3 — Core/Dispensable & Groups
Biological question: What fraction of the pangenome is shared across all accessions (core), and how much is dispensable? Can I identify nodes specific to one subspecies vs. another?
This use case illustrates two complementary analyses available in GraTools:
Core vs. Dispensable ratio using the
pan_ratiocommandSubspecies-specific node identification using the
specific_groups_samplecommand
Both are applied to the Asian Rice PVG [Marthe et al., 2025] with 13 accessions from [Zhou et al., 2020], including 8 indica and 5 japonica samples.
Part A: Core vs. Dispensable Ratio
The pan_ratio command computes the proportion of nodes categorized as core (shared by a
user-defined percentage of haplotypes) or dispensable (present in only a few haplotypes).
Users can also apply a minimum length filter to focus on larger structural variants.
gratools pan_ratio \
  --gfa NewRiceGraph_MGC.gfa.gz \
  --input-as-percentage \
  --shared-min 90 \
  --specific-percent-max 10 \
  --filter-len 50
--input-as-percentage: thresholds are expressed as percentages--shared-min 90: a node is core if present in ≥ 90% of haplotypes--specific-percent-max 10: a node is specific if present in ≤ 10% of haplotypes--filter-len 50: only consider nodes with length ≥ 50 bp (focus on SVs)
Results (Asian Rice, 13 accessions):
Category |
Count |
Total |
Percentage |
|---|---|---|---|
Core (raw, all sizes) |
7,963,273 |
26,461,214 |
30.09% |
Dispensable (raw, all sizes) |
3,824,526 |
26,461,214 |
14.45% |
Core (filtered, ≥ 50 bp) |
1,380,679 |
2,233,791 |
61.81% |
Dispensable (filtered, ≥ 50 bp) |
40,656 |
2,233,791 |
1.82% |
Nodes filtered out by length |
24,227,423 |
26,461,214 |
91.56% |
Note
The large difference between raw (30%) and filtered (61.81%) core values reflects that the vast majority of nodes in the graph are very short (mostly SNPs), as confirmed by the fact that 91.56% of nodes are smaller than 50 bp.
Part B: Subspecies-Specific Nodes
The specific_groups_sample command identifies nodes shared within a set of samples or
exclusive to one group compared to another.
Here we characterize nodes specific to indica vs. japonica subspecies with 3 commands to produce the Venn diagram below.
Step 1: Prepare Input Lists
Os117425RS1
Os125619RS1
Os125827RS1
Os127518RS1
Os127564RS1
Os127652RS1
Os127742RS1
OsIR64RS1
AzucenaRS1
IRGSP
Os128077RS1
Os132278RS1
Os132424RS1
Step 2: Run the Three Commands
Nodes shared by all 13 accessions (Core shared):
gratools pan_ratio \
  --gfa NewRiceGraph_MGC.gfa.gz \
  --input-as-percentage \
  --shared-min 100 \
  --specific-percent-max 10
Nodes in all indica but absent from all japonica (Core Indica):
gratools specific_groups_sample \
  --gfa NewRiceGraph_MGC.gfa.gz \
  --samples-list-A samples_indica.txt \
  --samples-list-B samples_japonica.txt
Nodes in all japonica but absent from all indica (Core Japonica):
gratools specific_groups_sample \
  --gfa NewRiceGraph_MGC.gfa.gz \
  --samples-list-A samples_japonica.txt \
  --samples-list-B samples_indica.txt
Step 3: Review Results
╭──────────────────────────────────── 📊  Shared & Specific Segment Analysis ────────────────────────────────────╮
│                                                                                                                │
│  Samples                                                                                                       │
│                                                                                                                │
│    List A         Os125619RS1  •  Os125827RS1  •  Os127518RS1  •  Os127564RS1  •  Os127742RS1  •  (+3 more)    │
│    List B         AzucenaRS1  •  Os128077RS1  •  IRGSP  •  Os132278RS1  •  Os117425RS1                        │
│                                                                                                                │
│  ──────────────────────────────────────────────────────────────────────────────────────────────────────────   │
│                                                                                                                │
│    Metric                                                              Count    Percentage     Total Length    │
│   ──────────────────────────────────────────────────────────────────────────────────────────────────────────  │
│    Shared  (present in ALL samples of List A)         8,111,924 / 26,461,214        30.66%   264,875,984 bp   │
│    Specific  (shared in A, absent from ALL in B)        568,805 / 26,461,214         2.15%     6,827,025 bp   │
│                                                                                                                │
│  Length filter: ≥ 0 bp     Total segments analyzed: 26,461,214                                               │
│                                                                                                                │
╰────────────────────────────────────────────────────────────────────────────────────────────────────────────────╯
╭──────────────────────────────────── 📊  Shared & Specific Segment Analysis ────────────────────────────────────╮
│                                                                                                                │
│  Samples                                                                                                       │
│                                                                                                                │
│    List A         AzucenaRS1  •  Os128077RS1  •  IRGSP  •  Os132278RS1  •  Os117425RS1                        │
│    List B         Os125619RS1  •  Os125827RS1  •  Os127518RS1  •  Os127564RS1  •  Os127742RS1  •  (+3 more)   │
│                                                                                                                │
│  ──────────────────────────────────────────────────────────────────────────────────────────────────────────   │
│                                                                                                                │
│    Metric                                                              Count    Percentage     Total Length    │
│   ──────────────────────────────────────────────────────────────────────────────────────────────────────────  │
│    Shared  (present in ALL samples of List A)         9,876,454 / 26,461,214        37.32%   287,672,694 bp   │
│    Specific  (shared in A, absent from ALL in B)        539,739 / 26,461,214         2.04%    10,733,238 bp   │
│                                                                                                                │
│  Length filter: ≥ 0 bp     Total segments analyzed: 26,461,214                                               │
│                                                                                                                │
╰────────────────────────────────────────────────────────────────────────────────────────────────────────────────╯
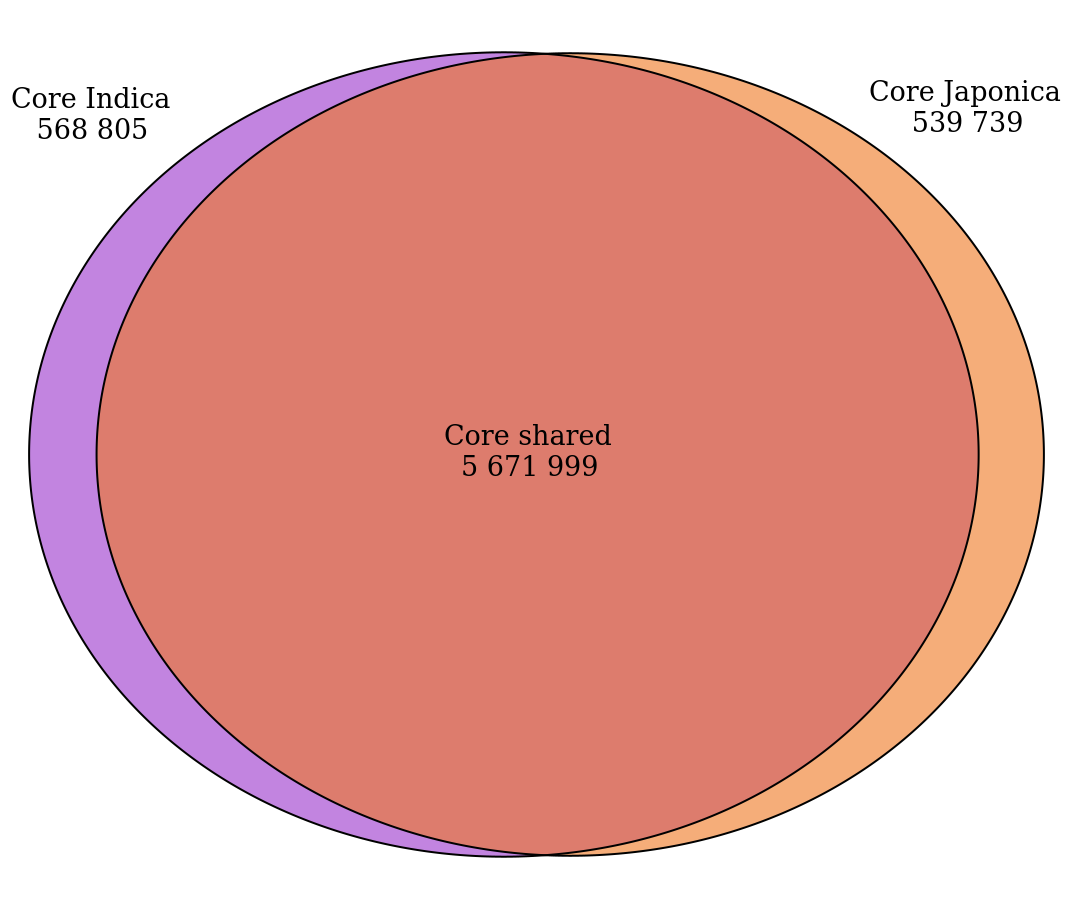
Strict core nodes (shared by 100% of haplotypes within each group) in indica (purple) and japonica (orange). The intersection represents nodes shared by all 13 accessions.
Summary
Command |
Description |
|---|---|
|
Compute core/dispensable ratio with optional length filter |
|
Find nodes exclusive to group A compared to group B |
See also
1 — Graph Description — Graph description
2 — Subgraph & FASTA Extraction — Subgraph and FASTA extraction
4 — Advanced Pangenome Size Analysis — Advanced pangenome size analysis