gratools pan_ratio
Analyze the ratio between core (shared) and dispensable (specific) segments in your pangenome.
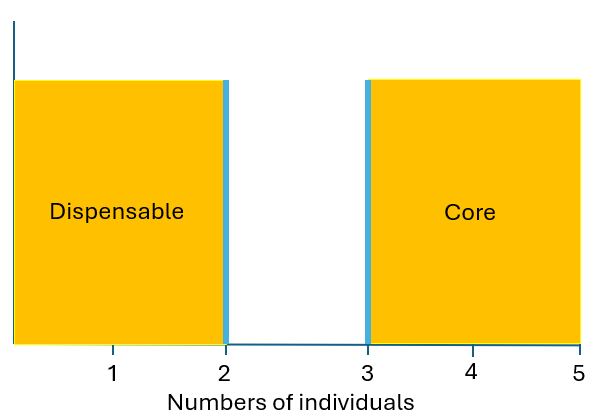
Segments shared by a high percentage or number of samples. This represents the stable, conserved part of the pangenome.
Segments specific to a few samples or unique individuals. This represents the accessory or flexible part of the pangenome.
Options
🛠️ View Command Line Options
$ gratools pan_ratio
Welcome to GraTools version: '0.1.0.dev134'
@author: GraTools team's
        ____                 __________               ____
      6MMMMMb/               MMMMMMMMMM               `MM
     8P    YM               /   MM     \               MM
    6M      Y ___  __    ___    MM   _____     _____   MM   ____
    MM        `MM 6MM  6MMMMb   MM  6MMMMMb   6MMMMMb  MM  6MMMMb\
    MM         MM69 " 8M'  `Mb  MM 6M'   `Mb 6M'   `Mb MM MM'    `
    MM     ___ MM'        ,oMM  MM MM     MM MM     MM MM YM.
    MM     `M' MM     ,6MM9'MM  MM MM     MM MM     MM MM  YMMMMb
    YM      M  MM     MM'   MM  MM MM     MM MM     MM MM      `Mb
     8b    d9  MM     MM.  ,MM  MM YM.   ,M9 YM.   ,M9 MM L    ,MM
      YMMMMM9  _MM_   `YMMM9'Yb_MM_ YMMMMM9   YMMMMM9 _MM_MYMMMM9
        \                                    /                /
        /''A''\          /''''''\           /     /''''A'''''\
  ...GC|       |..ATG...C...CG...T....TAG..'..GC.|            |...
        \..C../      \.............../            \...TATA.../

Please cite our gitlab: https://forge.ird.fr/diade/gratools.git\

Usage: gratools pan_ratio [OPTIONS]
Aliases: ratio

  This command analyzes segments in the GFA to determine the ratio of core
  segments (shared by almost all samples) versus the dispensable ones (present
  in a smaller subset of samples). The thresholds for defining 'core' and
  'dispensable' can be specified as an absolute number of samples or as a
  percentage of the total number of samples embedded in the GFA. A filter on
  segment length can also be applied. Results are displayed in the terminal and
  saved to a CSV file. This command relies on a pre-existing GraTools import of
  the input GFA.

  For more details, see the full documentation:
  https://gratools.readthedocs.io/en/latest/commands/pan_ratio.html

Pan Ratio Ratio Options:
  -g, --gfa PATH
     Path to the input GFA file (e.g., myGraph.gfa or myGraph.gfa.gz).
     [required]

  -o, --outdir DIRECTORY
     Output directory for GraTools results. If not specified, results are
     typically placed in a subdirectory within the GFA file's parent directory
     (e.g., 'GraTools-output_<gfa_name>').

  -su, --suffix TEXT
     Custom suffix to append to output filenames. If not provided, a default
     suffix will be generated based on the command line parameters.

  --input-as-number / --input-as-percentage
     Specify whether --shared-min and --specific-max are absolute numbers or
     percentages.  [required]

  -sm, --shared-min TEXT
     Minimal number/percentage of samples embedded in for a segment to be
     'core'.  [required]

  -spm, --specific-max TEXT
     Maximal number/percentage of samples embedded in for a segment to be
     'dispensable'.  [required]

  -fl, --filter-len INTEGER
     Minimal segment length (bp) to be included in the analysis. A value of 0
     means no length filter.  [default: 0]

Logging Options:
  -vv, --verbosity [DEBUG|INFO|ERROR]
     Set the logging verbosity level.  [default: INFO]

  -l, --log-path DIRECTORY
     Directory where the log files will be saved. If not specified, logs will be
     placed in the main output directory (or in a default GraTools log
     location).

Performance Options:
  -t, --threads INTEGER
     Number of threads to be used for parallelizable operations.  [default: 1]

Other options:
  -h, --help
     Show this message and exit.
Usage Example
In this example, we analyze a GFA with 5 samples.
Core threshold: Shared by at least 4 samples (
--shared-min 4).Dispensable threshold: Present in 2 or fewer samples (
--specific-max 2).Filter: Only segments ≥ 50 bp are considered for the filtered stats (
--filter-len 50).
$ gratools pan_ratio -g Og_cactus.gfa.gz --input-as-number \
    --shared-min 4 --specific-max 2 --filter-len 50 --threads 4
Output Summary:
─────────────────────────────────────────── Summary ──────────────────────────────────────
Total segments in GFA: 2,354,995
Total segments analyzed: 2,354,995
Total segments passing length filter (≥ 50bp): 210,046 (8.92%)

                         Core vs. Dispensable Segments — Og_cactus
╭────────────────────────────────────────────────────┬───────────┬───────────┬────────────╮
│ Category                                           │     Count │     Total │ Percentage │
├────────────────────────────────────────────────────┼───────────┼───────────┼────────────┤
│ Shared (Core) - Raw                                │ 1,162,062 │ 2,354,995 │     49.34% │
│ Specific (Dispensable) - Raw                       │   891,345 │ 2,354,995 │     37.85% │
│ Shared (Core) - Filtered (Length >= 50bp)          │   195,840 │   210,046 │     93.24% │
│ Specific (Dispensable) - Filtered (Length >= 50bp) │     8,602 │   210,046 │      4.10% │
│ Segments Filtered Out by Length                    │ 2,144,949 │ 2,354,995 │     91.08% │
╰────────────────────────────────────────────────────┴───────────┴───────────┴────────────╯
Understanding the Results
Percentage based on all segments in the GFA.
Shared (Core) - Raw: The number of core segments as a percentage of all segments in the GFA.
Specific (Dispensable) - Raw: The number of dispensable segments as a percentage of all segments in the GFA.
Percentage based only on filtered segments (≥ --filter-len).
Shared (Core) - Filtered: The number of core segments that also meet the length filter, as a percentage of only the filtered segments. This shows the composition of the longer segments.
Specific (Dispensable) - Filtered: The number of dispensable segments that meet the length filter, as a percentage of only the filtered segments.
Filtered Out: The total number and percentage of segments that were excluded from the “Filtered” analysis because they were shorter than the –filter-len value.
Process & Logic
The --shared-min (-sm) and --specific-max (-spm) options specify the number of samples a segment must be found in to be considered part of the “core” or “dispensable” genome, respectively.
Input mode: The user must specify whether the thresholds are :
Use --input-as-number.
Example: --shared-min 4 means the segment must be in 4+ samples to be Core.
Use --input-as-percentage.
Example: --shared-min 90% means the segment must be in 90% of samples.
Example: For the command gratools pan_ratio –input-as-number –specific-max 2 –shared-min 4, the minimum number of samples for a segment to be “core” is 4, and the maximum number of samples for it to be “dispensable” is 2.
The --filter-len (-fl) option excludes short, often uninformative segments from the “Filtered” analysis. This helps focus on structural variations and significant genomic regions.
In many pangenome graphs, a large number of segments are very short (1-50 bp). Use --filter-len to see the “real” structural core genome, as short segments can sometimes skew the percentage towards core due to graph complexity.
📑 Quick Links
Command Import: gratools import
Related Tool: gratools depth_nodes_stat